As the SEC cautions SPAC managers about the use of projections, an FTI Consulting analysis of SPAC valuations reveals reasons for caution.
In recent years, one of the big advantages of the SPAC merger for private companies when going public over choosing a traditional IPO was the acceptance of using forward-looking projections in investor presentations. However, questions about the implications of relying upon projections have lately dogged the SPAC universe and focused attention on some transactions after the fact.
Based on media reports, a cautionary tale may be the recent experience of Lordstown Motors, which went public in a de-SPAC merger last year. Lordstown subsequently fell short of its projected backlog, future production and revenue. Its CEO and CFO resigned and the stock price fell by two-thirds from its 52-week high.1
In April, an official at the Securities and Exchange Commission issued commentary cautioning about the use of projections in the context of SPAC mergers.2 As a result, SPAC mergers are under increased scrutiny and focus. FTI Consulting, with the goal of understanding some of the key drivers of SPAC valuations, analyzed trends in financial projections for announced SPAC merger transactions over a five-year period beginning in 2016 and concluding on March 31, 2021.3
What follows is a look at FTI Consulting’s findings, which show three significant trends: 1) SPACs and the resulting newly public companies are increasingly being traded based on multiples of forward revenue (not the more traditional multiples of historical revenue and earnings); 2) projection periods are growing longer; and 3) those forward revenues are projected to grow at much higher rates.
The Projection Landscape
FTI Consulting collected data from 216 of 250 companies that published projections in their investor presentations during the time frame of the analysis. The presentations targeted existing SPAC shareholders to support the merger proxy voting process as a communications tool to the broader capital markets, and as a mechanism to “cleanse” the confidential information received by PIPE investors. Two interesting points emerged.
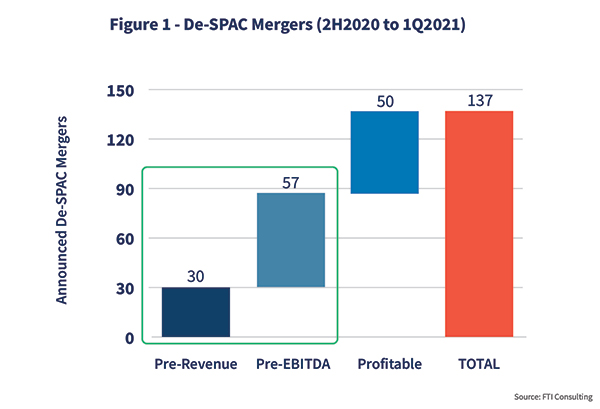
Less Mature Companies On the Rise
As seen in figure 1, the data revealed that a surprising 64 percent — almost two-thirds — of SPAC-announced mergers in the past year have been for pre-revenue, pre-EBITDA companies. This compares with just one-quarter of such companies in the period between 2016 and early 2020.
Companies Extend the Projection Period at Higher Growth Rates
As seen in figure 2, the less mature companies accessing the SPAC market used very high growth rates in projections and required longer projection periods to tell their stories. During 2016 and 2017, for instance, 71 percent of de-SPAC mergers included projections. By 2021, that percentage grew to 94 percent.
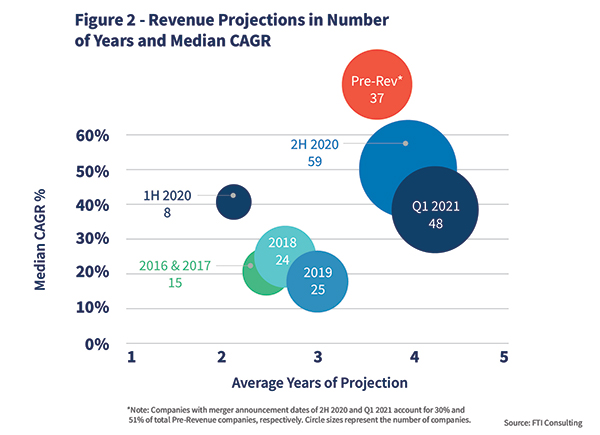
As projections become a critical tool for communicating prospects for a target company, the median length of the forward-looking period has grown — from two and a half years in 2016 to over four years in the first quarter of 2021. This extension creates greater uncertainty of delivering results with precision.
Meanwhile, the median CAGR of projected revenues in the earlier period averaged 21 percent as compared to over twice that rate, 40 to 50 percent, in the latest periods.4
Sectors in the SPAC Market
Accessing an Expanded Investor Base
Most SPACs have targeted tech-enabled sectors, a common theme for venture capital and public investors. Fintech, proptech, biotech, clean tech and media tech have become shorthand names for emerging sectors of tech-enabled disruptors to traditional industries.
In the past, companies in these sectors would have accessed privately managed funds from venture capital, private equity or project finance lenders. These sources would provide funding but with strings attached, such as active corporate governance/management, strict covenants based on milestones, or financial performance benchmarks with the expectation of very high returns.
Once the new companies achieved a critical size and maturity, they would go public to raise needed capital and to enable earlier investors, lenders, or both to cash out or be repaid. By contrast, the SPAC market has allowed public investors — institutional and retail — to invest earlier in the life cycle of these fast-growing companies than was previously possible.
Growth Rates Compared
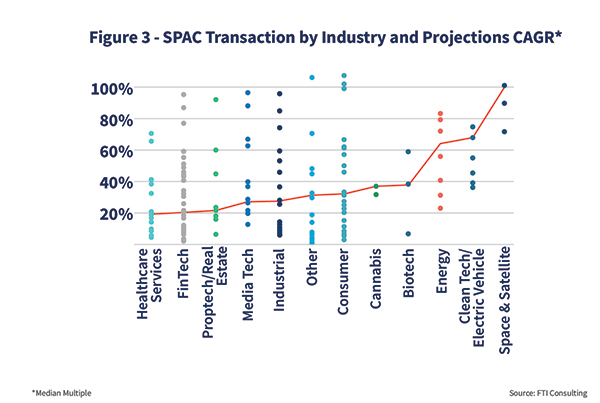
Figure 3 compares the relative growth rates of these new sectors. The highest median growth rates are in the space & satellite, energy, clean tech/electric vehicles and biotech sectors. The lowest median projected growth rates were in the healthcare services, fintech and proptech/real estate services, industrial and consumer sectors.
These align generally with the overall maturity of the sectors: The lower projected growth rates are in the more mature sectors, near or above positive EBITDA, while the higher projected growth rates are in the newer, emerging sectors, with a heavier concentration in pre-revenue situations.
Determining Valuations
Based on deal multiples for the 216 companies (calculated on projected revenues and earnings, to the extent they have earnings), a market has sprung up for young pre-revenue and pre-EBITDA companies to achieve multi-billion-dollar valuations. This is not out of line with the explosion of the so-called unicorn private companies (with private valuations in excess of a billion dollars), which exceed 700 worldwide.5
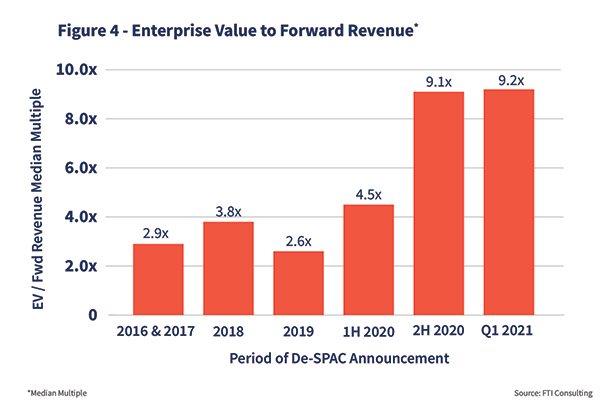
Interestingly, these companies may represent future de-SPAC merger candidates. Figure 4 demonstrates the dramatic shift upward of projected multiples of revenues from 2016 to 2019 ranging from 2.6 times to 3.8 times, increasing to 4.5 times in early 2020, and then more than doubling to 9.2 times in late 2020 and the first quarter of 2021. These reflect company valuations similar to late-stage venture investments, but naturally they come with the attendant risks associated with such companies.
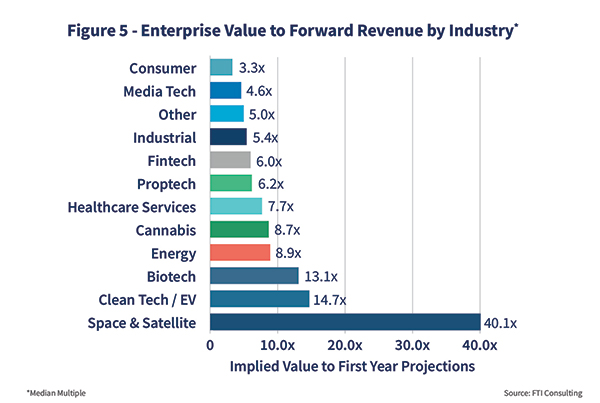
FTI Consulting also calculated the various acquisition multiples by sector and ordered them by rank accordingly. (See Figure 5.) The lower multiples are represented by the consumer, media tech and healthcare services sectors, with the highest multiples represented by space & satellite, clean tech/electric vehicles and biotech sectors.6
Some SPAC stocks may have traded above or below their IPO prices, and some PIPEs are done at prices different from the SPAC IPO price. But FTI Consulting took each company value as represented in their respective investor presentations and did not attempt to determine market value at any other date.
Caution is Warranted
The April commentary by the SEC was directed toward managers of both SPACs and their target companies. Specifically, it advised about the use of projections that may show only the most optimistic trajectory of future operating and financial performance because doing so may not sufficiently disclose risks to existing and prospective investors.
Management teams are now thinking through the implications of the advisory. They are considering more careful, detailed financial modeling and more rigorous testing of assumptions for achievability, and are creating more robust financial planning & analysis capabilities as part of their public company readiness preparations. That caution is well founded based on FTI Consulting’s analysis of the increased use of projections and on current transaction multiples.
When the story of today’s SPACs is written we believe that successful de-SPAC mergers will be those that deliver on three key factors:
- Reasonable financial projections supported by a robust and resilient operating plan.
- A management operating model that supports the public company requirements across finance, technology, commercial and operations functions.
- Timely and complete communications to all stakeholders, including investors, lenders, analysts and public shareholders.
Successfully delivering on all three factors will have a long-term benefit for both the SPAC and its target merger companies.
Authors:
- Stuart B. Gleichenhaus, Senior Managing Director
- Bill Stotzer, Managing Director
- Emeka Ndukwe, Senior Director
Compliments of FTI Consulting – a member of the EACCNY.