The percentage of loans paying off on their balloon date rebounded in January after a sharp drop in December. The latest reading is about 25 points higher than the December rate of 49.6%, which was the lowest reading since July 2012. The January rate was 71.9% which is above the 12-month moving average of 66.1%. (This number sums the averages of each month and divides by 12–there was no balance weighting across the months.) The highest rate in the last five years was in November 2013, when payoffs totaled 81.3%. (Trepp began measuring this statistic in August 2008.)
By loan count (as opposed to balance), 70.9% of loans paid off in January. On this basis, the payoff rate was up over seven points from December’s 63.7% level. The 12-month rolling average by loan count is now 70.5%.
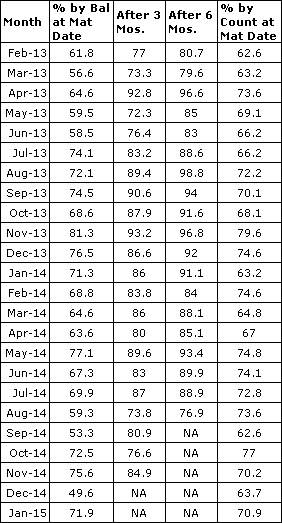
Listed below is the data for the last 24 months. The second column shows the percentage of loans (by balance) that paid off in the month of the maturity date. The third and fourth column contain the percentages that paid off (again by balance) after three months and six months, respectively. (After three 3 months, the percentage of loans that payoff really starts to level off.) In the last column is the percentage of loans, by count, that paid off in the balloon month.
This statistic was developed for the purpose of honing extension scenario assumptions. The analysis looks only at loans that have gotten all the way to their balloon date without having prepaid or defeased. If a loan paid off or defeased in the months prior to maturity (one month, five months, fifty months–it doesn’t matter), it is not part of the percentages above. The table only contains data on loans that survive to their balloon date.
Again, since so much attention was and is being paid to the extension trade, we were aiming for a measure of what percentage of loans would fail to payoff. Hopefully the data above will allow investors to refine their expected extension scenarios–particularly for IOs and first pay bonds. With regard to our methodology, we exclude a whole host of loans from the analysis.
The pool counts only fixed rate, US conduit loans (no floaters). All defeased loans are excluded. All ARD loans (anticipated repayment date) are also excluded, as the borrower is permitted to extend these loans for many years without triggering a default. Any loan that is delinquent going into the month that it is slated to payoff in is not included in the results. With regard to the last point, we wanted to measure only the loans that were “clean” going into the balloon month so that we could isolate the percentage of loans that were extending due to an inability to obtain refinancing rather than ongoing cash flow issues.
Compliments of Trepp, LLC – A member of EACC New York |©1997-2015 Trepp, LLC. All Rights Reserved.