The decline in valuations in Series C and later transactions from the peaks reached in the middle of 2015 has been well publicized. Valuations for Series B rounds have also fallen from their highs in 2015. In each case, the decline has been substantial. In Q2 2016, median valuations for Series B and Series C and later financings were below their medians for the past five years. On a more positive note, the percentage of up-round financings has remained high compared to the years prior to 2015. Moreover, amounts raised in Series A and Series B transactions remained strong; in particular, the median amount raised in Series A and Seed financings in Q2 was the highest it’s been in the past five years.
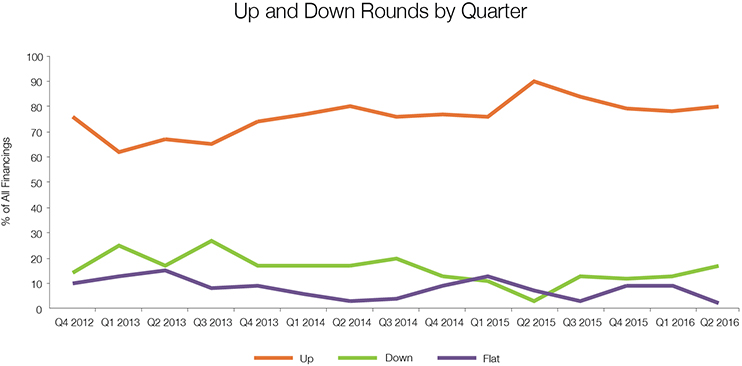
Up and Down Rounds
Seventy-nine percent of all financings were up rounds in Q2 2016, only slightly less than in Q1 2016, and five percentage points above their five-year median (from Q3 2011 through Q2 2016) of 74%. The percentage of down rounds increased from Q1 2016, rising to 18% of post-Series A financings, one percentage point above their five-year median of 17%. Flat rounds dropped from 7% in Q1 2016 to 3% in Q2 2016.
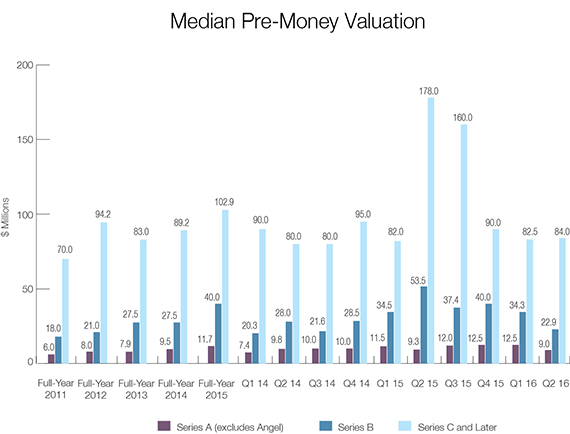
Valuations
The median valuation for Series A and Seed financings fell to $9.0 million for Q2 2016—well below the $11.7 million figure for full-year 2015, but comparable to the $9.5 million median for full-year 2014. It was also well above the five-year median of $8.0 million.
Pre-money valuations for Series B rounds also declined. The median valuation for such rounds dropped to $22.9 million in Q2 2016—less than half of the historic high median of $53.5 million seen in Q2 2015 and even below the five-year median of $30.0 million.
Valuations for Series C and later deals remained well below the high levels reached in Q2 and Q3 2015. At $84.0 million in Q2 2016, the median valuation for these later-stage rounds wasbelow their five-year median of $92.8 million .

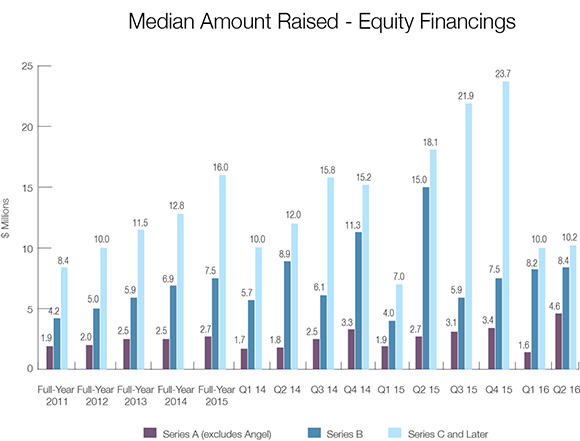
Amounts Raised
The median amount raised in Series A and Seed transactions rose dramatically from $1.6 million in Q1 2016 to $4.6 million in Q2 2016, the highest median quarterly figure in the past five years.
Median amounts raised in Series B as well as Series C and later transactions remained relatively stable. The median Series B amount raised increased slightly from $8.2 million in Q1 2016 to $8.4 million in Q2 2016. Similarly, the median amount raised in Series C and later transactions increased slightly from $10.0 million to $10.2 million.
Deal Terms – Preferred
The use of senior liquidation preferences rose in Series B and later rounds, increasing modestly from 33% of all such rounds in 2015 to 40% in 1H 2016. The increase was particularly strong for down rounds, where Series B and later financings with a senior liquidation preference increased from 35% of all such transactions in 2015 to 45% for 1H 2016.
The percentage of financings having a liquidation preference with participation remained constant for all financings. More interestingly, the proportion of Series B and later up rounds with a participating preferred increased, while the proportion of down rounds plummeted from 47% in 2015 to 18% in 1H 2016. This may be a statistical anomaly resulting from the small number of down rounds in the first half of this year, or it may reflect decisions to forgo such rights in transactions where prior rounds also lacked such rights.
The first half of 2016 also saw a reversal of the recent decline in the use of broad-based, weighted-average anti-dilution protection, which had decreased from 90% of all deals in 2013 to 80% of all deals in 2015. In 1H 2016, by contrast, investors received broad-based, anti-dilution protection in 91% of all deals. Conversely, the use of narrow-based, weighted-average anti-dilution fell from 13% of all deals in 2015 to 1% of all deals in 1H 2016.
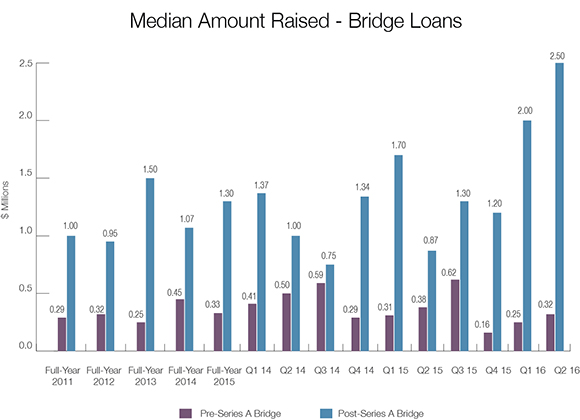
Bridge Loans
The median amounts raised for both pre-Series A loans and post-Series A loans increased for the second consecutive quarter, likely reflecting a desire to delay pricing an equity round. The median amount raised for post-Series A loans was particularly notable, increasing to $2.5 million in Q2 2016, markedly higher than in any of the prior five years.
Deal Terms – Bridge Loans
Interest rates declined for pre-Series A loans, with the percentage of deals with rates under 8% increasing from 74% of such deals in 2015 to 84% in 1H 2016. Conversely, for post-Series A deals, rates above 8% climbed from 13% of deals in 2015 to 21% in 1H 2016, likely reflecting increased difficulty in fundraising.
In addition, maturities for post-Series A loans lengthened. Maturities of exactly 12 months rose from 8% of all deals in 2015 to 31% in 1H 2016, although much of this increase came from a reduction in maturities of less than 12 months, which fell from 34% to 16%.
Price caps and discounts upon conversion became more popular for pre-Series A bridge loans. Price caps increased from 64% of deals in 2015 to 84% in 1H 2016, and discounts on conversion of pre-Series A loans also rose, from 78% of deals in 2015 to 87% in 1H 2016. On the other hand, the size of discounts dropped, with the percentage featuring a discount of over 20% declining from 16% of such loans in 2015 to 7% in 1H 2016.
Again, the reverse was true for post-Series A bridge loans. Conversions subject to a price cap dropped from 26% of loans in 2015 to 14% in 1H 2016, and post-Series A loans converting at a discount dropped from 71% of deals in 2015 to 63% in 1H 2016. The amount of discounts over 20% for such loans also declined from 27% of deals in 2015 to 17% in 1H 2016.
Compliments of WSGR – a member of the EACCNY