Trepp’s July loss analysis showed a second straight month-over-month drop in CMBS loans resolved with losses. Four loans took losses of 100% or more and two B notes were written off in full. Another two B notes were resolved with less than 100% loss.
The $65.00 million Philips at Sunrise Shopping Center loan was disposed with a 20.88% loss and the $33.00 million Goodwin Square office loan in Hartford, CT took an 83.60% loss.
Ignoring one small manufactured housing loan that took a 150% loss, Office and Mixed Use loans had the highest loss severities at 43.84% and 43.43% respectively. Retail loans accounted for the most disposed with losses by count (30) and balance ($276.31 million).
We also look at historical loss severity from the perspective of loan size and months to recover. In the first table below, we break out losses by major property type for all loans in July. The second table eliminates loans with losses of less than 2% of the loan balance, and again allocates losses by major property type.
July Average Loss Severity by Property Type – All Loans

July Average Loss Severity by Property Type – Losses > 2% of Loan Balance

Next we provide a breakdown of loss volume and severity over the last 67 months by loan size. The first table includes all losses while the second only includes losses greater than 2%.
Average Loss Severity by Loan Size for Last 67 Months – All Loans

Average Loss Severity by Loan Size for Last 67 Months – Losses > 2% of Loan Balance

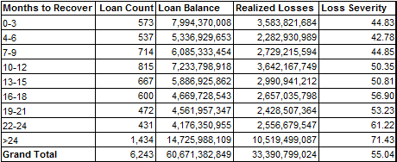
The final chart provides of a view of loss severity based on the number of months between the last paid-through date and the disposition date. The first table includes all losses while the second only includes losses greater than 2%.
Average Loss Severity by Months to Recover – All Loans

Average Loss Severity by Months to Recover – Loss > 2% of Loan Balance
Compliments of Trepp, LLC – A member of the EACCNY