Overview
“[A]s we know, there are known knowns; there are things we know we know. We also know there are known unknowns; that is to say we know there are some things we do not know. But there are also unknown unknowns — the ones we don’t know we don’t know. And if one looks throughout the history of our country and other free countries, it is the latter category that tends to be the difficult one.” — Former United States Secretary of Defense Donald Rumsfeld, February 2002 (emphasis added)
As we reflect on the current state of the mergers and acquisitions (M&A) market, I am reminded of one of my favorite quotes, reprinted above, in which Mr. Rumsfeld was commenting about the lack of evidence linking the government of Iraq with the supply of weapons of mass destruction to terrorist groups. Mr. Rumsfeld eloquently breaks down the future into three succinct categories, namely the “known knowns,” the “known unknowns,” and the “unknown unknowns.” Let’s apply this to the current M&A environment.
The Known Knowns
We know the M&A market has been on overdrive for the past five years. In 2015 we saw activity hit an all-time high as measured by total value.
We know valuation multiples in terms of EBITDA (earnings before interest, taxes, depreciation, and amortization) are also at or near peak levels. Such valuation premiums — relative to more typical market environments — are difficult to quantify, though it appears to average (based on our proprietary analysis of nonpublic information of multiples paid) in the 1.0x to 3.0x range. Furthermore, just as remarkable (and even more difficult to quantify) is the widespread sentiment among dealmakers that even the most “storied” or difficult and cyclical companies are generating interest in the current environment. The one notable exception is the oil and gas sector, whose recent turmoil has kept many potential buyers on the sidelines, at least for the moment.
We know both strategic and financial buyers are willing to pay these higher multiples in order to put cash to work.
We know unemployment continues its steady downward trajectory, consumer confidence continues its upward trajectory, and domestic gross domestic product (GDP) continues to exhibit signs of longer-term stability in spite of a soft fourth quarter (where such softness was attributed to increased imports combined with decreased federal spending, decreased nonresidential fixed expenditures, and decreased exports).
The Known Unknowns
We know overall industrial activity is slowing, but we do not know whether negative top-line growth is a real, or simply perceived, near-term threat.
We know that corporate profits have been buoyed by deflationary raw material inputs; many commodities, from copper to corn, are at or near recent lows. We do not know how much longer this benefit will last.
We know the debt markets are beginning to soften, but we do not know how much further, nor how quickly, lenders will tighten their lending guidelines.
We know that public equity markets have seen a pullback in prices, but we do not know if, or when, such a contraction in M&A multiples will occur.
The Unknown Unknowns
“[I]t is [the Unknown Unknowns] that tend to be the difficult ones.”
We do not know how bad the Chinese economy really is. Nor do we know whether the country’s recent slowdown is due to the natural evolution from a government-led to a consumer-led economy, or a precursor to systemwide failure due to years of misguided overinvestment. If it is the latter, China is on the verge of a major financial crisis that would undoubtedly pull much of the Asian region down with it.
We do not know how the U.S. economy would react to a major external shock to the system (e.g., terrorist activity, North Korea nuclear attack, etc.).
Finally, we do not know how buyers will react in the face of continued pressure on top-line growth prospects. Will such buyers take a “long-term” view, or will they (as has typically been the case) begin to lower bid prices to better align with long-term average multiples?
In summary, as we pause to reflect on where we are in the cycle, we see that the fundamental forces driving M&A activity and valuation multiples are no longer as perfectly aligned as they once were. This is not to say that a major pullback in prices is imminent. Rather, we no longer expect continued multiple expansion but instead view multiple normalization as an ever-increasing possibility.
M&A Market Activity
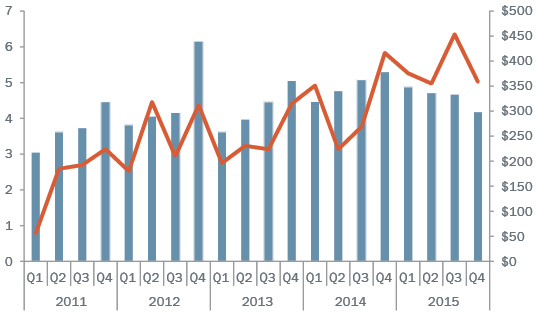
Improved availability of capital, better and sustained company performance, and narrower valuation gaps have powered U.S. M&A transaction activity since 2010. The second half of 2015 shows significant momentum in overall transaction value but notable softness in M&A volumes. See Figure 1.
Figure 1 | Total U.S. M&A Deal Volume and Value by Quarter
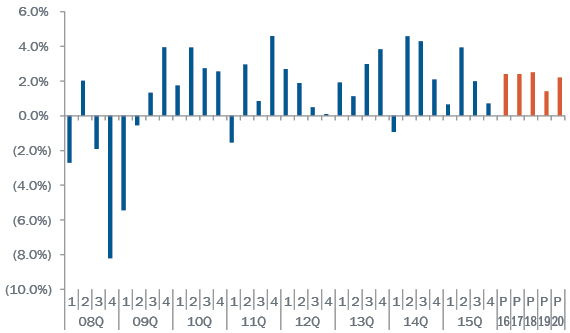
U.S. GDP, often viewed as a proxy for the overall health of the economy, has recovered from the contraction experienced during the recession in the late 2008 and early 2009 time frame, as seen in Figure 2. While few economists are predicting another recession in the near future, neither are forecasters predicting rampant growth. That said, GDP growth in the fourth quarter was a relatively benign 1.0%.
Figure 2 | Change in U.S. Gross Domestic Product
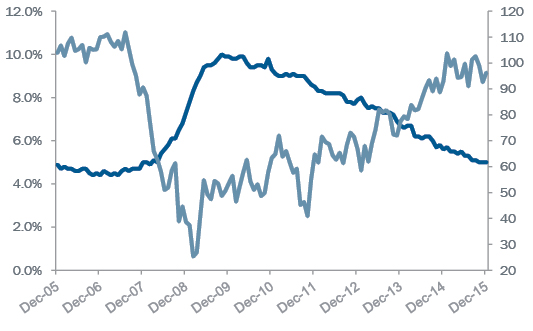
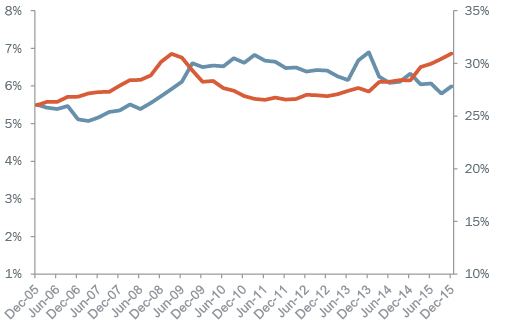
Consumer confidence generally improves as the unemployment situation improves. Fortunately, unemployment maintains its steady march downward and sits at levels not seen since mid-2008 (see Figure 3). Consumer confidence remains buoyant, which, combined with the improvement in the labor market, suggests continued favorable tailwinds through 2016.
Figure 3 | Unemployment and Consumer Confidence
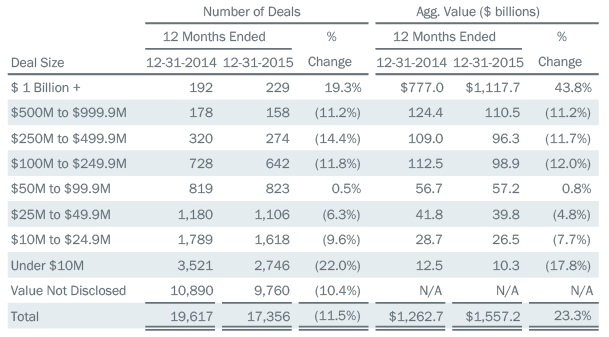
As mentioned in previous articles, data on lower middle market transactions is notoriously difficult to come by, but year-over-year comparisons can prove illustrative. Volume and total value of deals falling within the lower middle market (in this context defined as transactions less than $250 million in total value) for 2015 were in line with the overall M&A market for the year, which is to say that overall volume was down but aggregate value was up (see Figure 4).
Figure 4 | Recent U.S. M&A Activity by Deal Size
Both strategic and financial buyers were active in 2015.
The stimulus for strategic-led deals is a combination of lower organic growth prospects absent acquisitions, accommodative senior debt markets for most of the past year, and a record amount of cash and other liquid assets held by nonfinancial companies. The post-traumatic stress disorder that drove firms to hoard cash appears to have abated post-recession. Furthermore, evidence of the accommodative debt markets (again, through at least November of last year) was clearly visible in the rapidly rising corporate debt levels. (See Figure 5.)
Figure 5 | Cash Holdings and Debt as a Percentage of Total Assets for the Largest Nonfinancial U.S. Publicly Traded Companies
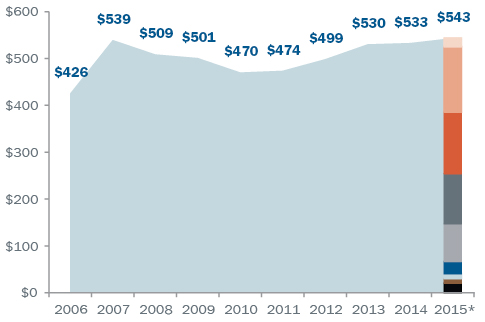
Complementing (from a seller’s perspective) strategic buyer interest is private equity, which remains a potent force in deal flow. Favorable credit markets and an estimated $543 billion capital overhang ($67 billion of which is nearing the end of its investment horizon) will continue to provide impetus for investors to remain competitive in transactions. Furthermore, it should be kept in mind that the capital overhang actually translates into $1 trillion or more in purchasing power, given the leverage available in today’s marketplace. (See Figure 6.)
Figure 6 | U.S. P.E. Capital Overhang by Vintage Year & Fund
Nowhere is the increase in current valuation multiples due to the aforementioned factors more evident than in the prices paid by private equity during the past five years. Such prices are a function of debt providers’ willingness to lend but are also a direct result of sponsors’ willingness, for the first time in history, to lower their required return thresholds. Historically, financial sponsors promised their limited partners an expected compounded annual return of 20-30%; however, recent feedback from many in the private equity community (all of whom wish to remain nameless) is that returns are instead being modeled in the high teens. Such a reduction in required returns has the same effect as a reduction in yields on bonds; i.e., when rates fall, the prices that buyers pay for new investments rise, as prices and rates move in opposite directions. The contraction in the reported multiples for 2015 may be a result of the increased number of targets available to be acquired, as the credit markets remained robust through the first 11 months of last year. But regardless of the reason, the median multiple for middle market LBOs in 2015 was the lowest in the past three years. (See Figures 7 and 8.)
Figure 7 | Median EBITDA Multiples for Middle Market Leveraged Buyouts
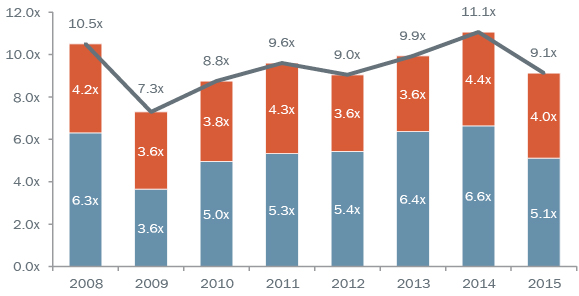
Figure 8 | Middle Market Deal Flow by Year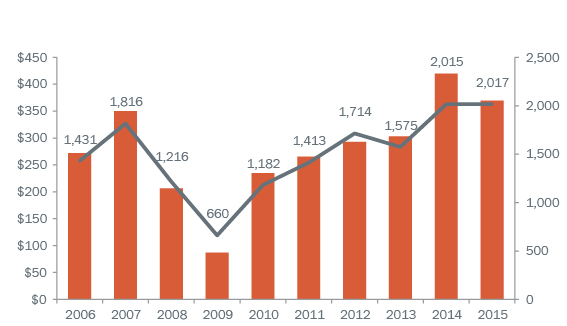
Conclusions and Outlook for 2016 and Beyond
Our view for the foreseeable future remains cautiously optimistic. Buyer appetites and resulting valuation multiples are still at or near historical levels. How long this will last is of course anyone’s guess; that said … for those business owners on the fence about selling their companies, it may be prudent to accelerate such decisions rather than wait for the “unknowns.”
AUTHOR:
• Gian G. Ricco, Senior Vice President, Chicago | gricco[at]srr.com | +1 312 752-3359
© 2016 Stout Risius Ross, Inc. – a member of the EACCNY