Second Highest Monthly Volume; Loss Severity Falls
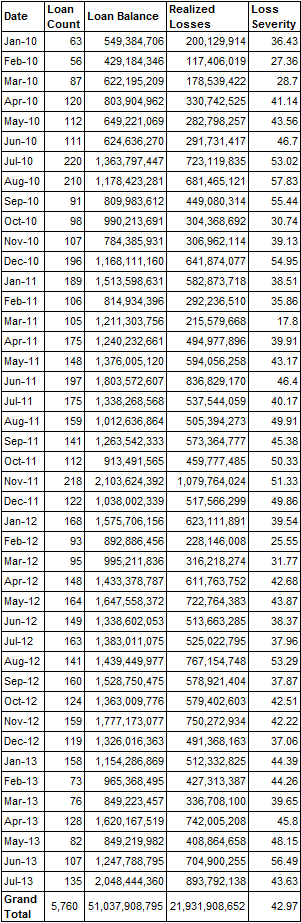
After a spike in loss severity last month, July saw a big jump in liquidated CMBS loan volume and a concurrent drop in loss severity. July brought the second highest liquidation volume since TreppWire started tracking the number in January of 2010. July liquidations totaled $2.05 billion, relative to the 12-month moving average of $1.35 billion. The highest monthly liquidated volume was in November 2011 with $2.10 billion in liquidated loans.
While November 2011 recorded 218 loans with losses and July counted only 135, this month saw the highest average liquidated loan size. The average size of liquidated loans in July was $15.17 million, above June’s $11.66 million and the highest monthly average since January 2010. July’s loan count was also up from 107 in June.
The 135 loan liquidations resulted in $893.79 million in losses, translating to an average loss severity of 43.63%. July’s loss severity was down from June’s reading of 56.49% but above the 12-month moving average of 44.49%.
Since January 2010, servicers have been liquidating at an average rate of $1.19 billion per month.
Below are the overall statistics for loans liquidated in July. The first table includes only US fixed rate conduit loans. (If a loan somehow managed to be liquidated with a profit or at par, we excluded the loan. If the loan suffered a loss of $1 or more, it is included in the numbers below.)
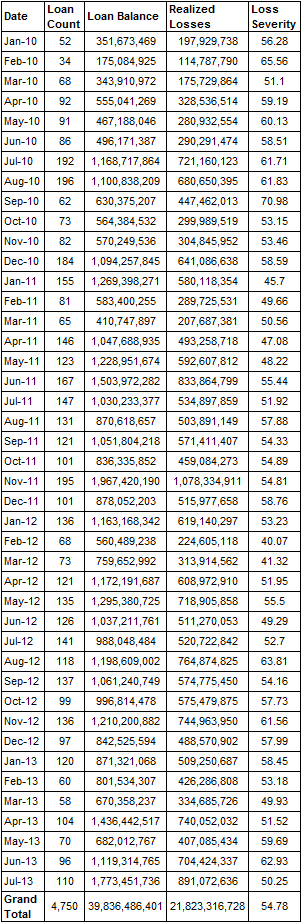
If one takes out the loans with losses of less than 2%, the story looks a little different. We suspect that in many cases the small loss loans are actually refinancings that have taken place where the losses reflect small, unpaid special servicer fees or other costs. On this basis–after taking out the “small loss” loans–about $1.77 billion in such loans were liquidated in July, compared to an average of $926 million over the last 43 months and $1.06 billion over the last 12 months.
The average loss severity on this basis is 50.25% for July–well below June’s 62.93%. July’s reading fell below the average monthly loss severity of 54.78% over the last 43 months and the 12-month average of 56.55%.
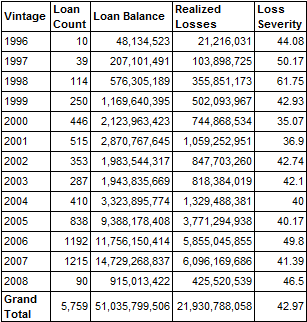
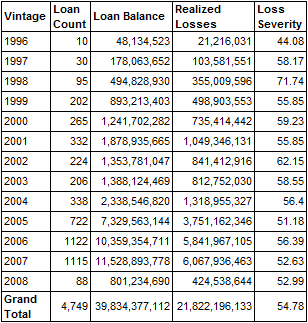
Next are the loss severity numbers by vintage. The first table includes all liquidations, while the second excludes loans with losses of less than 2%.
Loan Liquidations since January 2010 By Vintage – US Fixed Rate Conduit Loans – All Loans
Loan Liquidations since January 2010 By Vintage – US Fixed Rate Conduit Loans – Losses > 2%
Look for July’s loss numbers broken out by property type and loan size in the coming days.