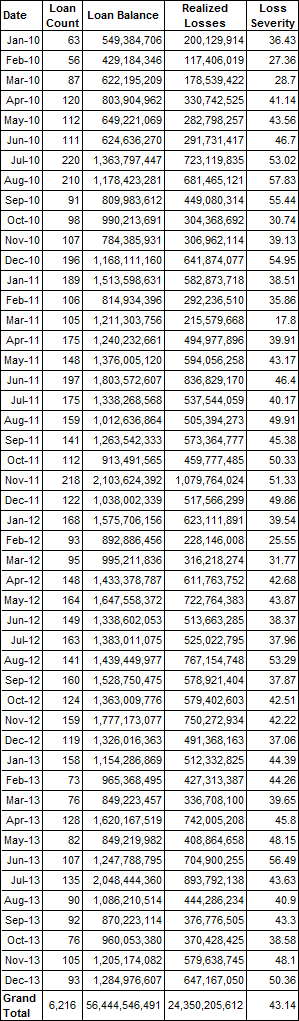
December liquidation volume and loss severity stayed fairly close to November’s levels, which were a rebound from two months of below average activity. Liquidation volume registered $1.28 billion in December, up slightly from $1.21 billion in November and in line with the 12-month moving average of $1.18 billion. Of the loans liquidated, 90% fell into the greater than 2% loss severity category.
December loss severity came in at 50.36%, up from November’s 48.10% and considerably higher than October’s 38.58%. The 12-month moving average for loss severity is 45.57%. The number of loans liquidated in December was 93, which resulted in $647.17 million in losses, making the average disposed balance of $13.82 million–well above the 12-month average of $11.64 million.
Since January 2010, servicers have been liquidating at an average rate of $1.18 billion per month.
Below are the overall statistics for loans liquidated in December. The first table includes only US fixed-rate conduit loans. (If a loan somehow managed to be liquidated with a profit or at par, we excluded the loan. If the loan suffered a loss of $1 or more, it is included in the numbers below.)
Loan Liquidations since January 2010 – US Fixed Rate Conduit Loans – All Loans
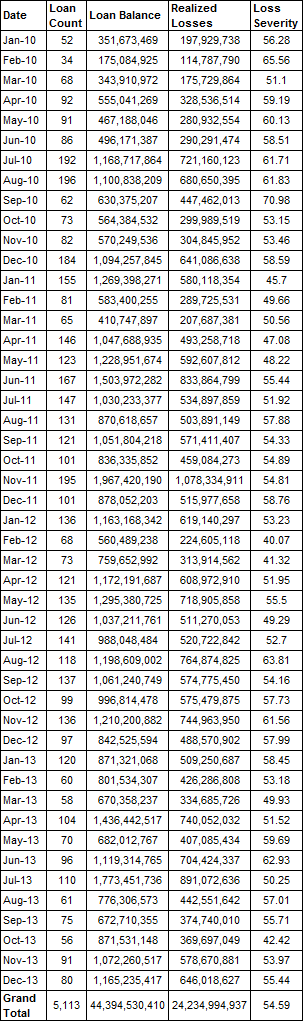
If one takes out the loans with losses of less than 2%, the story looks a little different. As we’ve noted in the past, we suspect that in many cases, the small loss loans are actually refinancings that have taken place where the losses reflect small, unpaid special servicer fees or other costs. On this basis–after taking out the “small loss” loans–$1.17 billion in such loans were liquidated in December, compared to an average of $924.89 million over the last 48 months and $992.71 million over the last 12 months.
The average loss severity on this basis is 55.44% for December—slightly up from November’s 53.97%. December’s reading fell in line with the 54.59% average monthly loss severity omitting losses of less than 2% over the last 48 months and 53.93% over the last 12-months.
Loan Liquidations since January 2010 – US Fixed Rate Conduit Loans – Losses > 2%
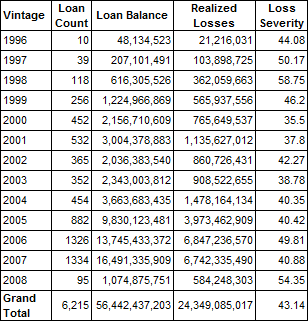
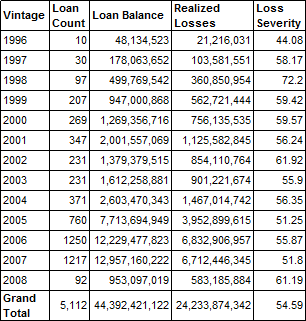
Next are the loss severity numbers by vintage. The first table includes all liquidations, while the second excludes loans with losses of less than 2%.
Loan Liquidations since January 2010 by Vintage – US Fixed Rate Conduit Loans – All Loans
Loan Liquidations Since January 2010 By Vintage – U.S. Fixed Rate Conduit Loans – Losses > 2%
Look for December’s loss numbers broken out by property type and loan size in the next few days.
Compliments of trepp, LLP – a EACCNY Member