A total of $30.68 billion of domestic, private-label CMBS was issued during the third quarter, pushing volume for the year through September to $90.85 billion.
That’s substantial. It compares with the $29.08 billion that was issued during last year’s third quarter and the $72.74 billion issued through the first nine months of 2024.
At the rate things are running now, the year could see more than $121 billion of issuance. To put that volume in perspective, annual issuance has averaged $74.29 billion when excluding the years before the Global Financial Crisis, when issuance surged, and the years immediately after, when issuance was nearly nonexistent.
The healthy issuance, which doesn’t include the suddenly vibrant collateralized loan obligation market, is a solid indication that mortgage financing is readily available for commercial properties.
The CMBS market is comprised of two main deal types: conduits—traditionally its bread-and-butter, designed as a “conduit” for originating and funding mortgages against middle-market properties—and single-asset, single-borrower (SASB) deals. Those could be behemoths and can be backed by one loan on an individual property—typically a trophy—or one or more loans against a portfolio of properties owned by one sponsor.
The year’s issuance has been dominated by SASB deals. The thinking is that investor demand for bonds from those deals remains extremely healthy. What now has become SASB loans used to be the purview of life insurance companies. It’s often more conducive for them to hold rated CMBS than unrated mortgages.
Let’s quickly turn our attention to what’s gone on in the conduit world. Lenders are active, but they’re not going wild. You won’t easily find an 80% loan-to-value mortgage from a conduit lender. In fact, the 31 conduit deals that priced this year through September had a weighted average loan-to-value ratio of 56.64%. Meanwhile, the average debt-service coverage ratio is 1.8x and that for debt yield is 12.65%. So, they remain relatively disciplined.
Conduit lenders favored apartment loans for their deals—23.75% of the year’s issuance was backed by such properties, down from 18.8% last year. However, they’ve warmed up to the office sector, which so far accounts for 15% of issuance, up from 13% for all of last year. And whereas last year’s conduit issuance had a 34.16% concentration of retail loans, that’s declined to 18.06% this year.
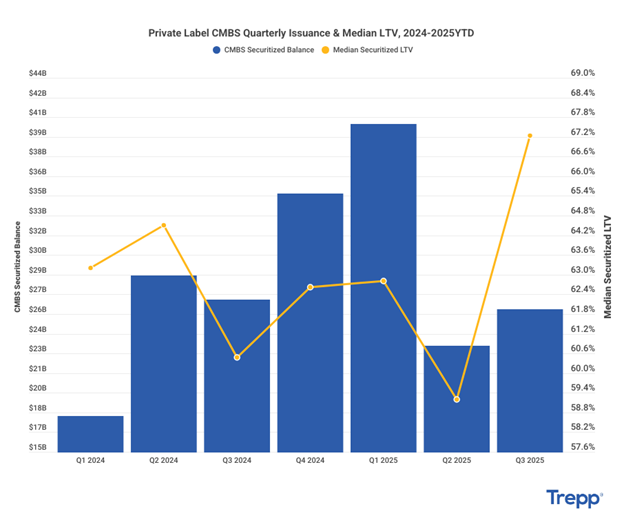
CMBS Issuance & Leverage Recap
Private-label CMBS issuance so far this year has reached the $90 billion mark and appears well on its way to outpacing 2024. This year’s volumes represent a recovery from the post-2022 trough, when quarterly issuance fell as low as $6 billion; they remain modest compared to the 2019–2021 cycle. Here we’ll examine credit metrics differently than in this morning’s Big Picture. The median loan-to-value ratio increased to 67.24% in the third quarter, the highest since early 2021 and well above the 59.20% recorded in the second quarter. The previous five quarters had median LTVs of 60-63%.
The current mix of strong issuance and leverage signals a shift in market posture. Historically, median LTVs above 67% were common during periods of strong liquidity, such as 2014-2015 and mid-2021, when issuance volumes were also robust. Today, however, monthly rolling averages for the past year are sticky around 60%, with some quarterly fluctuations as seen above. This suggests that CMBS underwriting in 2025 is more cautious than in recent memory.
For more information, please contact the Trepp team at therundown@trepp.com.
Compliments of Trepp – a Premium Member of the EACCNY